 Eastern Mojave Vegetation
 Eastern Mojave Vegetation
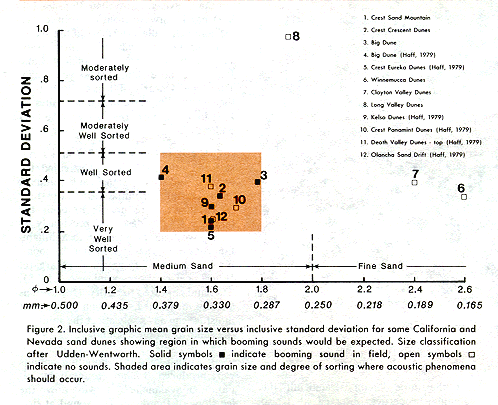
| Figure 2. Grain size vs. standard deviation of grain size. |
|
|

If you have a question or a comment about this photograph you may write to me at: tomas@schweich.com I sometimes post interesting questions in my FAQ, but I never disclose your full name or address. |

Full figure caption: "Figure 2. Inclusive graphic mean grain size versus inclusive standard deviation for some California and Nevada sand dunes showing region in which booming sounds would be expected. Size classification after Udden-Wentworth. Solid symbols indicate booming sound in field, open symbols indicate no sounds. Shaded area indicates grain size and degree of sorting where acoustic phenomena should occur."
Article records that use this photograph:
Other photos about Geology or Geomorphology, Sand Dunes.
|
|
Date and time this page was prepared: 5/12/2025 3:03:59 PM |